Representing US
Our nonpartisan Representing US project has been exploring the differences across all 435 U.S. House districts—from education and poverty levels, to racial and immigrant make-up, to congressional and presidential voting history, and more.
With this, our third release of Representing US, we’re highlighting the November 6, 2018, election outcomes.
Revisit our pre-election RepresentingUS content including our Demographics Tool and Voting Insights Tool.
The midterm elections erased what was a 43-seat advantage for the Republicans and handed the majority to the Democrats. As of November 28, Democrats had won 234 seats, including 42 formerly Republican districts. Republicans had claimed 200 seats, including three flipped from the Democrats. One race (California’s 21st district) has yet to be officially called. Explore all the results in our interactive tools below.
JUMP TO CONTENT
Midterms 2018: Which U.S. House seats were held or flipped by each political party?
Midterms 2018: Where did women win U.S. House races?
Midterms 2018: How close was the U.S. House race?
Midterms 2018: How red or blue was the outcome of each race?
Midterms 2018: How strong was support for Trump in 2016, compared to which party won the seat in 2018?
Midterms 2018: Which U.S. House seats were held or flipped by each political party?
HOVER OVER ANY DISTRICT FOR DETAILS
APM Research Lab, Representing US project. Last updated Nov. 28, 2018.
KEY FINDINGS
Democrats held 192 seats (including five in redistricted Pennsylvania). Democrats also flipped 42 seats from Republicans (including four in Pennsylvania’s revised districts). Democrats have control of 234 seats, with one race (California’s 21st) yet undecided. Democrats have gained the majority in the U.S. House by surpassing 218 seats.
Republicans successfully defended 197 of their seats (including eight in redistricted Pennsylvania). However, Republicans only flipped one Pennsylvania seat, along with two other districts (Minnesota’s 1st and 8th) from the Democrats. Republicans have won 200 seats, with one race remaining uncalled.
Midterms 2018: Where did women win U.S. House races?
HOVER OVER ANY DISTRICT FOR DETAILS
APM Research Lab, Representing US project. Last updated Nov. 28, 2018.
KEY FINDINGS
A record-setting 102 congresswomen are headed to the upcoming 116th Congress’ House of Representatives.
Thirteen Republican women won a seat in the U.S. House of Representatives, resulting in a victory for 25 percent of all Republican women running. Additionally, 89 Democratic women won their congressional district races, or 48 percent all Democratic women running.
Midterms 2018: How close was the U.S. House race?
HOVER OVER ANY BAR FOR DETAILS
APM Research Lab, Representing US project. Last updated Nov. 28, 2018.
KEY FINDINGS
Among called races, the narrowest margins of victory so far were in Utah’s 4th district and Georgia’s 7th district. In both, 0.2 percentage points separated the candidates after all votes were counted.
Eighteen races were uncontested in 2018, compared to 28 in 2016’s election.
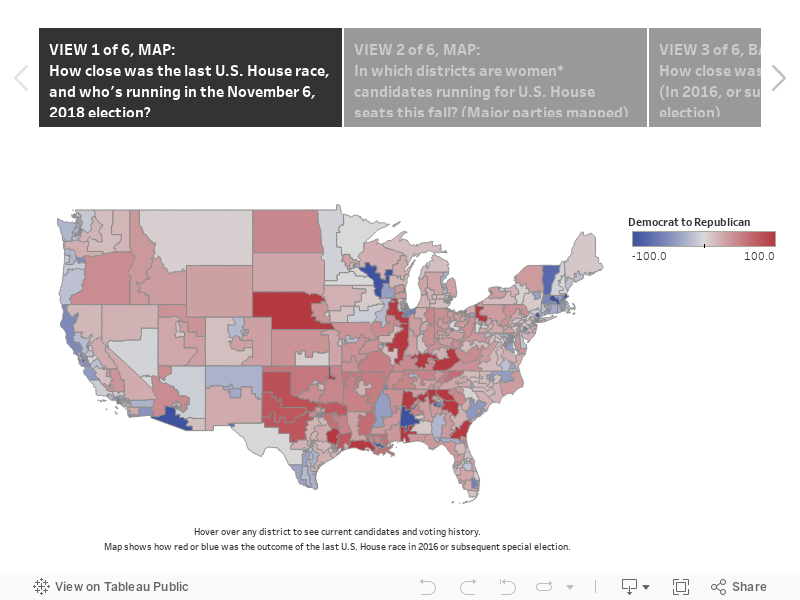
Midterms 2018: How red or blue was the outcome of each race?
HOVER OVER ANY DISTRICT FOR DETAILS
APM Research Lab, Representing US project. Last updated Nov. 28, 2018.
KEY FINDINGS
As of November 28, there were 44 races that were won by five percentage points or less.
In addition, California’s 21 district is not decided. A 0.4 percentage point difference currently separates leading candidate T.J. Cox (D) and incumbent David Valadao (R). Results have not been certified yet by the state as of November 28.
Midterms 2018: How strong was support for Trump in 2016, compared to which party won the seat in 2018?
HOVER OVER ANY BAR FOR DETAILS
APM Research Lab, Representing US project. Last updated Nov. 28, 2018. Pennsylvania results not available due to redistricting since 2016.
KEY FINDINGS
Twenty-nine House districts that voted in greater numbers for President Trump over Hillary Clinton in 2016 sent a Democrat to Congress in 2018. Most notable was Minnesota’s 7th district, in which voters sent longstanding Democratic congressman Collin Peterson back to Congress by a four-point margin, despite favoring President Trump by 31 percentage points.
Only two districts that favored Clinton over Trump in 2016 sent a Republican to the U.S. House in 2018: New York’s 24th and Texas’ 23rd district. Republican incumbents John Katko and Will Hurd won by 6, and 0.5 percentage points, respectively, in those districts.
Notes about use
On social media, please use the hashtag #RepresentingUS. Users may freely use data and images from this page. Please include the following citation and link. Source: APM Research Lab, “Representing US, 2018.” Available at: bit.ly/RepresentingUS .
You may also wish to see our second release of our Representing US tools (pre-election content including candidate data and demographic and economic data by district) or our first release of Representing US tools in our Tableau gallery. Please email us at info@apmresearchlab.org with any additional questions about these tools.
How to navigate these tools
On map views, use + or – (in toolbar along the left side of any map view) or your mouse scroll wheel to zoom in and out. You may also click the magnifying glass icon and enter a location to zoom to it. Use the cross-shaped tool to pan and move about, including locating data for Hawaii or Alaska.
Click the home icon or refresh your browser page to reset the view. All bar graphs and tables may be sorted (high-to-low, low-to-high, or alphabetically) by clicking the sort icon (three stacked bars).
Click here if you do not know your U.S. House district to locate it by your zip code, or use the magnifying glass icon on the map views to identify district(s) associated with a zip code, city, state, or other geography.
Data sources and notes
The 2018 election results were sourced from the New York Times ’ 2018 coverage. (D) refers to Democrat, (R) refers to Republican, (I) refers to independent, (L) refers to Libertarian, and (G) refers to Green party.
The above maps do not use the February 2018 district boundaries issued by the Pennsylvania Supreme Court as updated boundaries were not yet available for these geographies. Complete results for Pennsylvania’s new districts are available in the “How close was the U.S. House race?” bar graph.
In the case of formerly vacant U.S. House seats, the party which last held the seat is used to determine who held or flipped the seat for the map titled “Which U.S. House seats were held or flipped by each party?”
Uncontested 2018 races as well as same-party races (e.g., Democrat vs. Democrats) are represented as 100% blue or red in the “How close was the U.S. House race?” bar graph and the “How red or blue was the outcome of 2018 midterm election?” map. In the case of a Democrat or Republican defeating a third party candidate, the respective margin of victory is shown as a percentage red or blue in the latter map.
Data on Trump/Clinton margin in 2016 by U.S. House district sourced from Cook Political Report’s most recent Partisan Voting Index by state and district, which uses data collected by POLIDATA. Further methodology can be found in the full Report by Cook. Data on 2016 U.S. House election results (and subsequent special elections) sourced from CNN , Politico the New York Times and states’ Secretary of State offices.
In some cases, margins of victory may differ slightly from the gap between candidates’ vote shares, due to rounding from figures with greater precision.
peter